CONTROL CHART FOR CONTINUOUS QUALITY IMPROVEMENT - ANALYSIS IN THE INDUSTRIES OF BANGLADESH

  • Tanmoy Das MIST
Keywords: Control Chart, Statistical Process Control, Data Mining

Abstract

This research aimed for collecting data relevant to statistical process control from prominent manufacturing
industries in Bangladesh and analyze the current situation of quality control in production line and apply
statistical process control tools, particularly, Control chart, to identify defects. Engineers do not design inferior
quality. Usually, in a certain stage of the system, in all scenarios of manufacturing or service industries, defects
occurs that cause worse quality. Statistical process control (SPC) is a great tool to explore those variations. The
author performs time series analysis using line graph and control chart to evaluate the system quantitatively.
This article provides an overview of control chart regarding manufacturing industries in Bangladesh and
implement control chart to remove out of control scenarios from the manufacturing processes. After analyzing
the data obtained from the manufacturing system, out of control or defective data point has been discovered
and removed, and thereafter the system is in control.
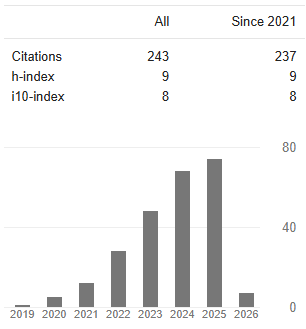
Downloads

Download data is not yet available.

References

[1] Goetsch, David L., and Stanley B. Davis. Quality
management for organizational excellence. Upper Saddle
River, NJ: pearson, (2014).
[2] Montgomery, Douglas C. Introduction to Statistical
Quality Control, 6th edition, John Wiley & Sons, Inc.
(2009).
[3] Qiu, Peihua. Statistical Process Control Charts as a Tool
for Analyzing Big Data. Big and Complex Data Analysis.
Springer International Publishing, (2017). 123-138.
[4] Montgomery, Douglas C., and Connie M. Borror.
Systems for modern quality and business improvement.
Quality Technology & Quantitative Management, (2017):
1-10.
[5] Huang, Q., and J. J. Shi. Stream of Variation Modeling
and Analysis of Serial–Parallel Multistage Manufacturing
Systems” journal of Manufacturing Science and
Engineering, (2004). 126: 611–618.
[6] Sarhangian, V., A. Vaghefi, H. Eskandari, and M. K.
Ardakani. Optimizing Inspection Strategies for Multi-stage
Manufacturing Processes Using Simulation Optimization,
Winter Simulation Conference. (2008).
[7] Maboudou-Tchao, Edgard M., Ivair R. Silva, and Norou
Diawara. Monitoring the mean vector with Mahalanobis
kernels. Quality Technology & Quantitative Management,
(2016): 1-16.
[8] Pimentel, Laura, and Fermin Barrueto. Statistical
process control: separating signal from noise in emergency
department operations. The Journal of emergency
medicine 48.5 (2015): 628-638.
[9] Jensen, Willis A. Statistical Process Control for the
FDA-Regulated Industry. Journal of Quality Technology
47.2 (2015): 204-206.
[10] Psarakis, Stelios, Angeliki K. Vyniou, and Philippe
Castagliola. Some recent developments on the effects
of parameter estimation on control charts. Quality and
Reliability Engineering International 30.8 (2014): 1113-
1129.
[11] Chen, Huifen, et al. Symmetric-charts: Sensitivity
to nonnormality and control-limit estimation.
Communications in Statistics-Simulation and Computation
46.1 (2017): 358-378.
[12] Nelson, L. S. Control charts. In S. Kotz, N. L. Johnson,
& C. B. Read (Eds.), The encyclopedia of statistical
sciences (1988). New York, NY: Wiley (Vol. 2, 2nd ed., pp.
176–183).
[13] Manyele, Samwel Victor. Analysis of the Effect of
Subgroup Size on the X-Bar Control Chart Using Forensic
Science Laboratory Sample Influx Data Engineering. 9.05,
(2017): 434.
[14] Madanhire, Ignatio, and Charles Mbohwa. Application
of Statistical Process Control (SPC) in Manufacturing
Industry in a Developing Country. Procedia CIRP 40,
(2016): 580-583.
[15] Baker Shenawy E. and Lemak, D. A Meta-Analysis of
the Effect of TQM on Competitive Advantage. International
Journal of Quality and Reliability Management, (2007).
24(5), pp. 442- 471.
Published
2019-12-16
How to Cite
Tanmoy Das. (2019). CONTROL CHART FOR CONTINUOUS QUALITY IMPROVEMENT - ANALYSIS IN THE INDUSTRIES OF BANGLADESH. MIST INTERNATIONAL JOURNAL OF SCIENCE AND TECHNOLOGY, 5(1). https://doi.org/10.47981/j.mijst.05(01)2017.123(%p)